





Columnist
Hyunjin Park OSULLOC e-Commerce Sales Team
Editor's Note
The things that don’t show up clearly in the numbers, but that we’re actually deciding every single day.
This series is about how those moments are made. I’ll unpack, one by one, the choices I make every day: which products to show first, how to address customers, and how to guide them through to a purchase.
We Are Persuaded by Numbers Every Day

<We live in a world in which we see so much through numbers: star ratings, reviews, and more.>
I once went to a restaurant with a 4.8-star rating and left disappointed. It had more than 300 reviews, so I assumed it was the real deal. Unless the numbers had been manipulated, that meant over 300 people had actually liked the place. For me, though, it wasn’t a good restaurant at all. What the numbers didn’t tell me was how many people out there have different tastes from mine. One person may have loved the atmosphere, another may have thought the price was fair, and another may have been perfectly happy there was no long wait.
Numbers don’t lie. That doesn’t mean they tell you everything. The real story a number tells sits somewhere between what shows and what stays hidden.
The Thicker the Report, the Further from the Answer

<What’s more important than a thick report is asking what should change.>
Back when I was an intern doing data analysis, my first assignment was simple yet enormously difficult. “Analyze how we could increase the number of secondhand transactions.” At first the question felt far too big. I had no idea where to start, so I began by pulling whatever data I already knew how to pull. Number of transactions, distribution by category, patterns by time of day, repeat transaction rate, and regional differences. If a metric looked even remotely relevant, I pulled it. Before long, the report ran to dozens of pages. Something felt off, though. The thicker the report got, the further I seemed to drift from the answer. Figures were everywhere, and yet the answer to one simple question kept getting blurrier: “What is the problem, and what would fix it?”
At first, I thought I needed to get better at SQL, the language used to work with data. I thought I needed to know more statistics. Those skills did matter, of course. Once the data was actually in front of me, however, what I needed more than the technical skill itself was the ability to read the numbers. Whether the numbers I was looking at really represented the whole picture. Whether any data was missing. Whether this metric explained the actual problem. The ability to pin those things down. From then on, what I reached for wasn’t more queries, but logical reasoning and data literacy.
Open a data set without a question, and all you have is a pile of numbers. You'd think more numbers would make you more objective but in practice they just pile up the judgment calls you have to make. I’ve since gotten into the habit of asking myself something before I even look at the data. “Is this number showing me the actual problem?” “If it’s a problem, which stage of the customer journey did it start at?” My reports got thinner and, paradoxically, more persuasive.
Why You Should Look Where There Are No Bullet Holes
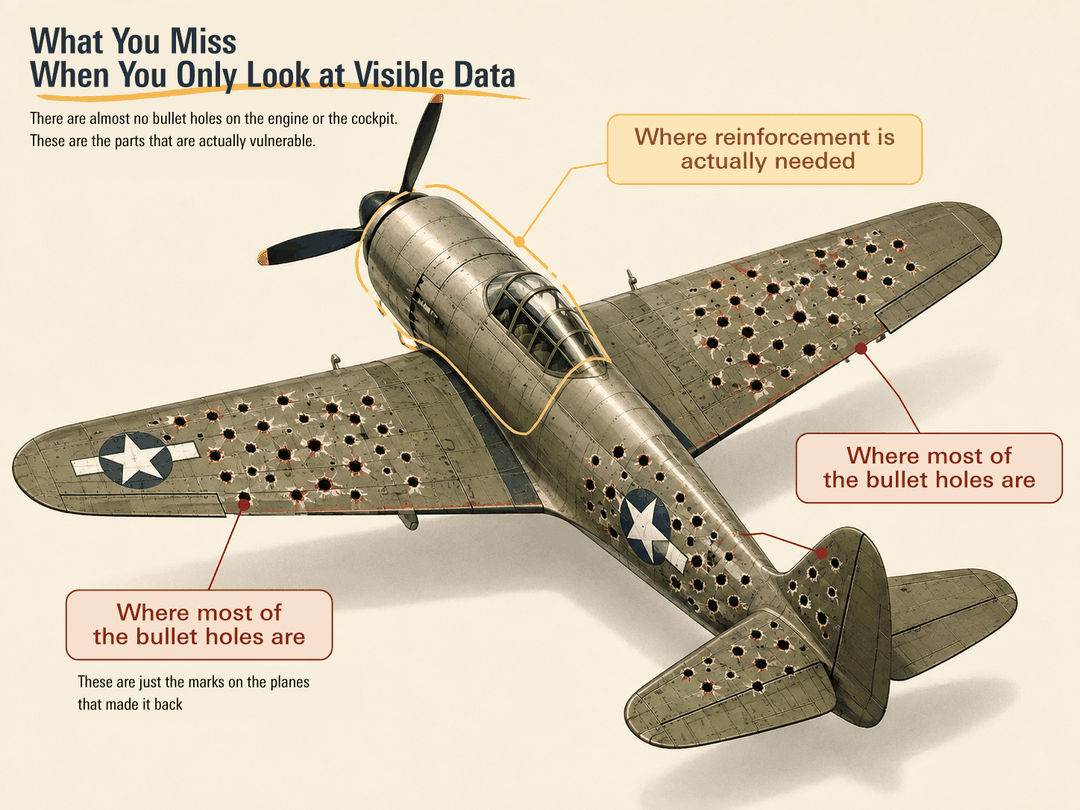
<The need for you to see beyond the data in front of you.> Source: AI-generated image
During World War II, the Allied forces examined the bullet holes left on the planes that came back to base after combat. On the planes that made it home, the bullet holes clustered on the wings and fuselage. By contrast, some areas, such as the engine, had relatively few. Look only at what came back, and the conclusion seems obvious. Reinforce the wings and airframe, where the bullet holes were thickest. The statistician Abraham Wald, however, focused on the exact opposite perspective. What needed reinforcing, he concluded, was not where the bullet holes were thickest, but where there were almost none.
The aircraft in the study had taken bullets in the wings and fuselage, but they had, in the end, made it back to base alive. Planes hit in a critical spot, like the engine, never came back, and so never included in the study. This case is often used to explain “survivorship bias”: focusing too much at the ones that survived that you miss the ones that never made it into the sample at all.
The same thing happens in our workplace. Customers who end up making a purchase leave a fairly clear trail. We can see which products they viewed, what they put in the cart, which coupons they used, and how much they paid. However, data rarely tells us why someone just glanced at a product and left, gave up on a search, or ran into friction during checkout but kept quiet.
So when we look at numbers, we have to think not only about the values inside the table but also about the situations that never made it into the table. We have to ask whose record the number in front of us is, which customer experiences are missing from it, and whether there are behaviors that were never measured in the first place. After all, reading numbers cannot end with accurately calculating the visible values — it has to extend to imagining and inferring what is not visible.
Even the Weakest Numbers Hide a Clue
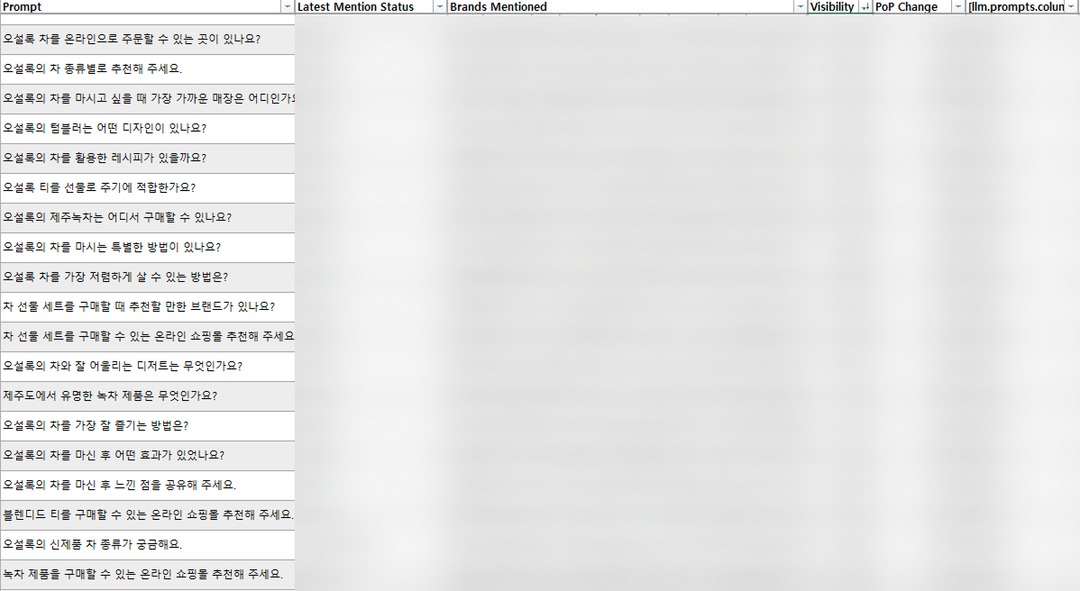
<Part of a report analyzing the visibility of the brand and the brand-owned online store within AI search. It lets us monitor which questions our brand site appears for and which questions it does not.>
One day I was going through search data, and the terms that caught my eye weren’t the ones with high click counts but the ones with plenty of impressions and a low click-through rate. On the numbers alone, those are poor-performing search terms. They drew impressions but didn’t lead to clicks, which you could read as inefficient. Turn them over, though, and they are also a signal: customers are already curious about these things, and we aren’t yet answering their questions well enough. Customers arrive with questions such as “caffeine-free tea,” “tea that makes a good gift,” and “tea that’s good iced,” and the site doesn’t yet have a good answer for them.
That was when my question changed. From “Which search terms are bringing in the most traffic?” to “What are customers already curious about, and are we answering those questions?” Read a low click-through rate as nothing more than weak performance, and that’s where it ends. However, if you gather up the questions sitting behind it, you can sometimes see a customer need we haven’t adequately met. A low number isn’t a failure so much as a signal, telling us what more we need to do next.
The Same Goes for AI: A Good Question Comes First
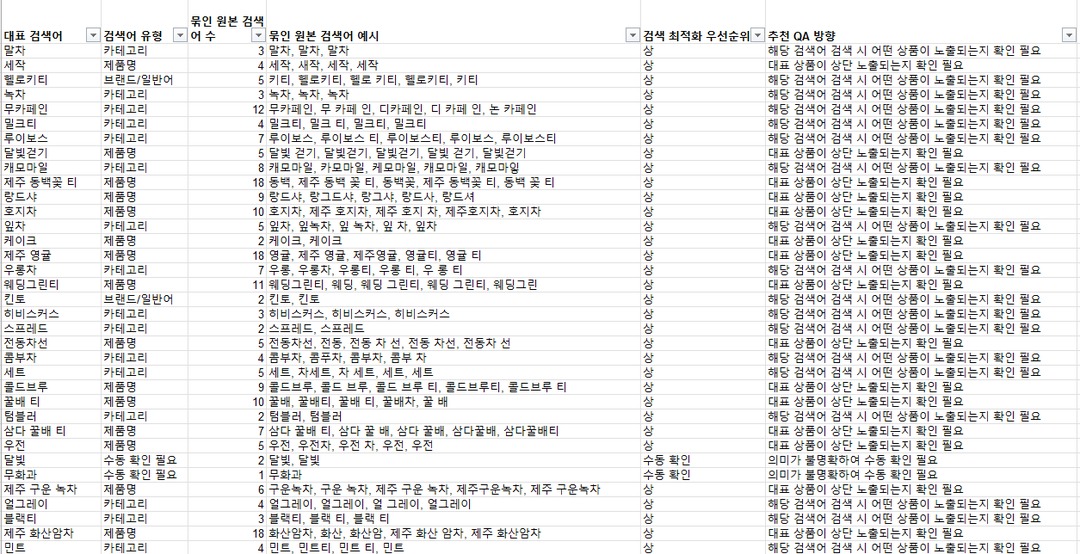
<One example of using AI to organize natural-language data quickly. It lets us rapidly classify search typos, search intent, and more within the OSULLOC online store.>
Lately, we’ve been using AI a lot more inside the company as well. It handles data organization, copy drafts, and even report summaries. Work that used to take an hour can now be done in ten minutes. The more I use it, though, the more one thing sinks in: the quality of the output is ultimately proportional to the quality of the question I put to it.
“Write me some copy.” “When a woman in her 40s thinking about a Lunar New Year gift arrives at the OSULLOC online store for the first time, write the opening line of a product detail page that helps her choose a tea bag set in the KRW 30,000 range without hesitation.” The results these two requests produce will be completely different.
Writing a request like the second one means knowing who the customer is, what situation brings them in, and where they hesitate. That understanding comes from data, from customer reviews, and even from conversations with the people you work alongside.
AI has become a tool that quickly executes the questions I build. That said I still believe it’s up to humans to decide which questions to ask. The same goes for numbers. There are more tools than ever for organizing and summarizing them, yet choosing which numbers to focus on remains a matter of human judgement.

<Designing a good customer experience means moving beyond the numbers and asking a good question.>
What I Try to Do in Front of the Numbers
There are also things I’m careful about when I look at numbers. The moment a metric becomes the goal ifself, a number can lose the meaning it originally carried. If raising the click-through rate is the only goal, you can write a more sensational line. If raising the conversion rate is the only goal, you can make the purchase button harder to miss. And yet, doesn’t each of those steps take us further away from the customer?
So these days, when I look at a number, I try to first ask what question it's posing to me. A number that defies expectations, a number that seems low yet strangely sticks in my mind, or a number that looks great but comes with no clear reason. More often than not, the clues for my next project have been hiding in numbers like these.
In the next episode, I’ll talk about how clues found this way lead to actual planning. A customer searches, compares, adds to the cart, and finally presses the purchase button. I’ll look at the hesitation that lies in between and how we can reduce it in promotions and UX.
 |
Hyunjin Park |
|
|
OSULLOC e-Commerce Sales Team
OSULLOC Official Online Store Planner
 |
|
-
Like
0 -
Recommend
0 -
Thumbs up
0 -
Supporting
0 -
Want follow-up article
0